Home
About
Insights
Methodologies
Contact
 EN
EN
Rangeland monitoring for Mongolia
Tracking Mongolia's Rangeland Productivity, One Pixel at a Time
Make informed livestock decisions with visual access to rangeland conditions in your area. Use this data to better plan grazing and adapt to environmental change.
27
years of satellite imagery, 2000–2026
339
soums covered, every year
1,100+
ground monitoring sites nationwide
80,000+
field survey records behind our models
150+
environmental indicators per map cell
25 winters of dzud risk
Our dzud risk index for every soum, every winter from 2000–01 to 2024–25. Watch the great dzuds build, from 2009–10 to the catastrophic 2023–24 double winter, when over 90% of the country was at high risk and millions of animals were lost.
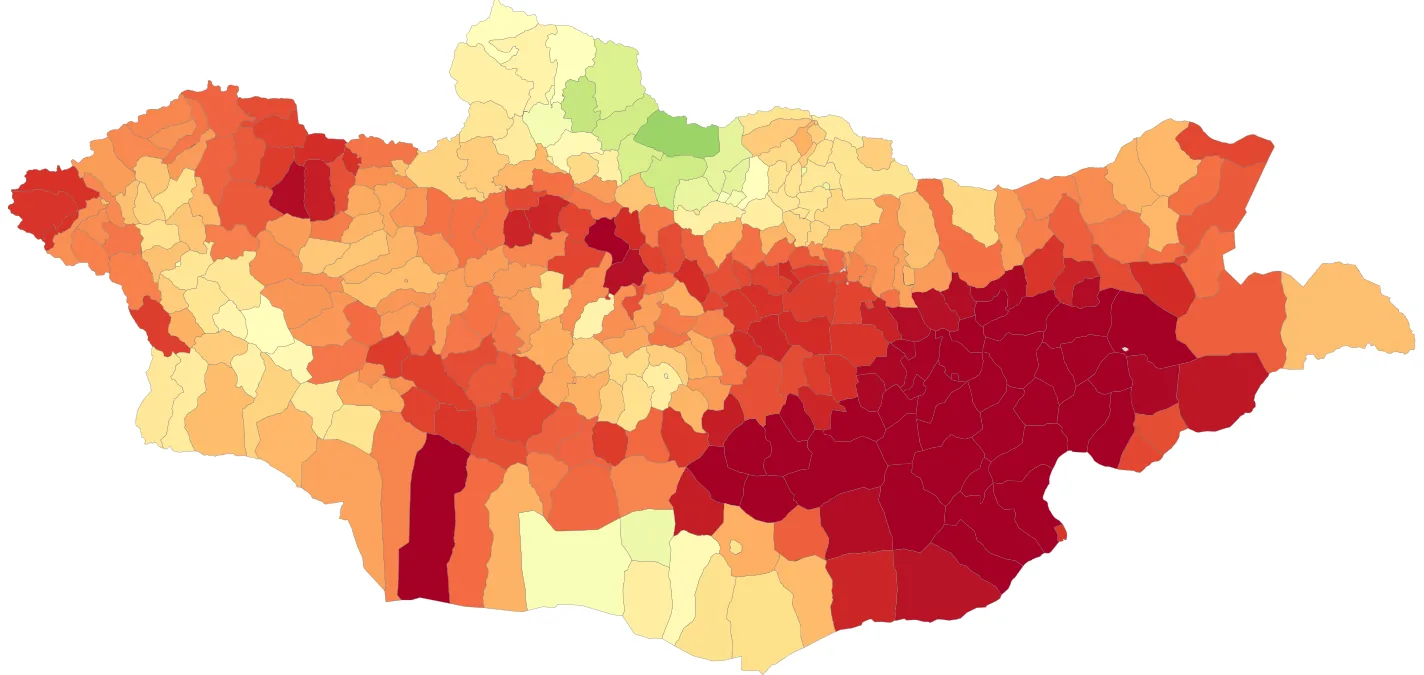
2023–24
Pasture-weighted soum mean of the dzud risk index, on one fixed colour scale so winters can be compared. Event notes are the historical record, not model output. Source: GreenZun Labs rangeland monitoring pipeline.
A Platform for Every Stakeholder

Herders
See real-time pasture conditions in your area, plan seasonal grazing and otor movements with confidence, and protect your herd with insurance you can understand and trust.
For example: check this season's pasture in your soum before planning an otor move.

Risk & Insurance Professionals
Use satellite-backed parametric indices to improve basis risk calculations, set transparent triggers, and design smarter, scalable livestock insurance products.
For example: compare a soum's dzud risk across 25 winters when setting a policy trigger.

Policymakers
Track 27 years of rangeland productivity trends across every aimag and soum to ground land-use, climate adaptation, and disaster-response policy in transparent, verifiable data.
For example: see which soums faced the highest dzud risk last winter, and how that compares with the past.
Data at a glance
We visualize 27 years of satellite and ground-based data to show how carrying capacity and pasture health have changed across Mongolia. Get a national picture of rangeland productivity trends over time. Support sustainable land use and climate adaptation policies grounded in real-time data.
Preview the dashboard →
How it works
Every map on this site comes from the same pipeline: satellite imagery and hand-collected field data, combined on one national grid and turned into three models.
01
Satellites and field crews
MODIS, Landsat and Sentinel imagery since 2000, checked against pasture plots, rangeland surveys and livestock records from ALAMGaC, NAMEM and NSO.
02
One national grid
More than 150 indicators for every cell of a grid covering the whole country, every year: greenness, rain and snow, heat and cold, terrain, soil and herd size.
03
Three models
Pasture biomass, rangeland productivity and dzud risk, each graded against places and records it was never trained on.
Latest from our research
See all insights →


About Us
We’re a small team with backgrounds in remote sensing, data science, and sustainable development working to build practical tools for climate adaptation in Mongolia.
Meet the team →